 SoftBests
PrometheusUnderrated
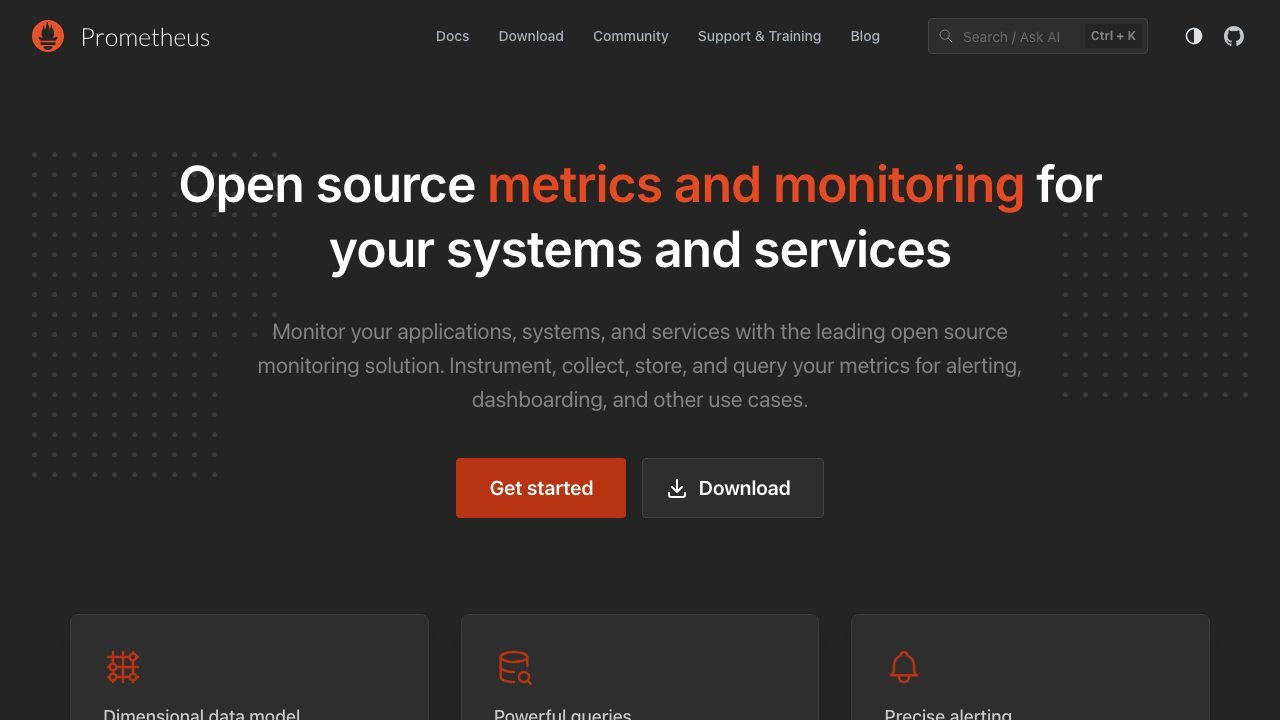
The pull-based metrics database that became the default way to monitor servers and services.
Best for
Teams running their own infrastructure who need alerting that does not depend on a SaaS vendor.
Why it deserves attention
Prometheus scrapes metrics endpoints on a schedule, stores them in a local time-series database with PromQL for querying, and evaluates alerting rules that fire through Alertmanager. Its pull model and exporter ecosystem mean almost every database, queue and web server already has ready-made instrumentation, and Grafana reads its data natively. It is a Cloud Native Computing Foundation graduated project, Apache-licensed, and single-binary easy to run. The trade-offs: the local storage is not clustered, so long-term retention needs remote-write to something like Thanos or Mimir, and PromQL has a learning curve that punishes casual use.
Ratings & reviews
0 ratings0 people rated this
No ratings yet. Be the first to rate this tool.
Can replace
- Nagios
Related and alternatives
More in Developer utilities
 Underrated
Agent Desktop
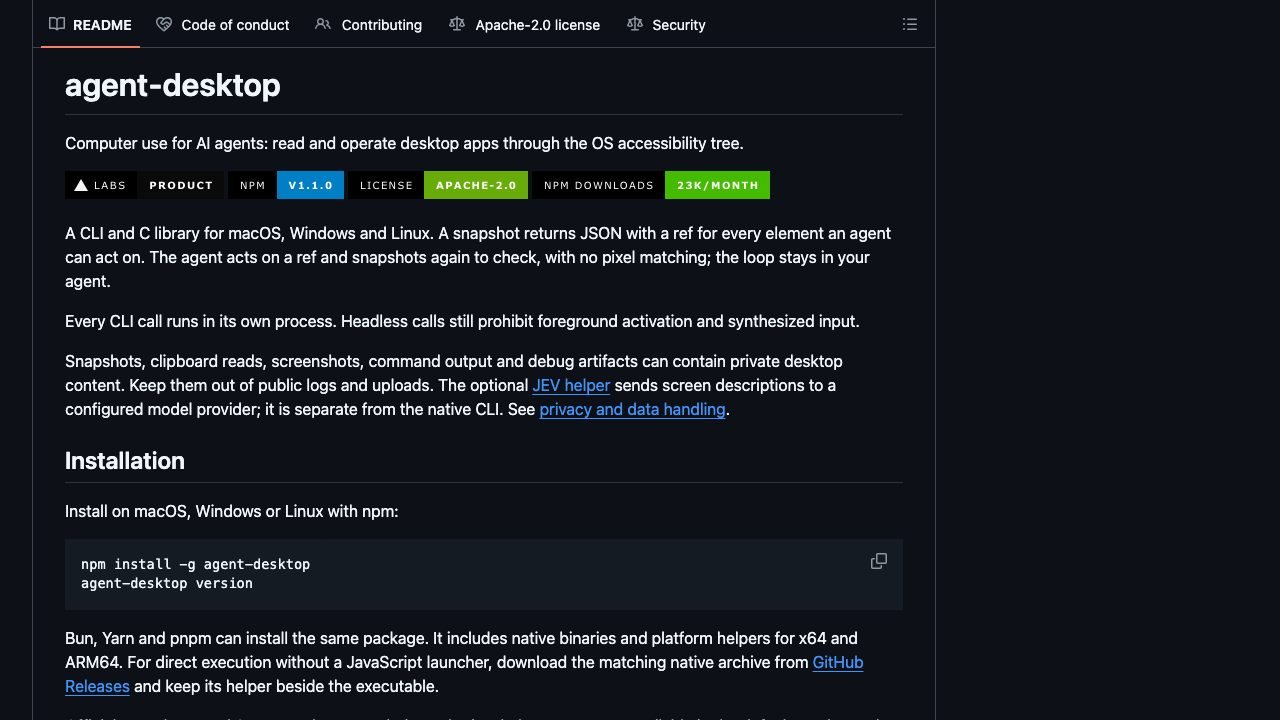
A CLI that lets AI agents read and operate desktop apps through the OS accessibility tree.
 Underrated
Beszel
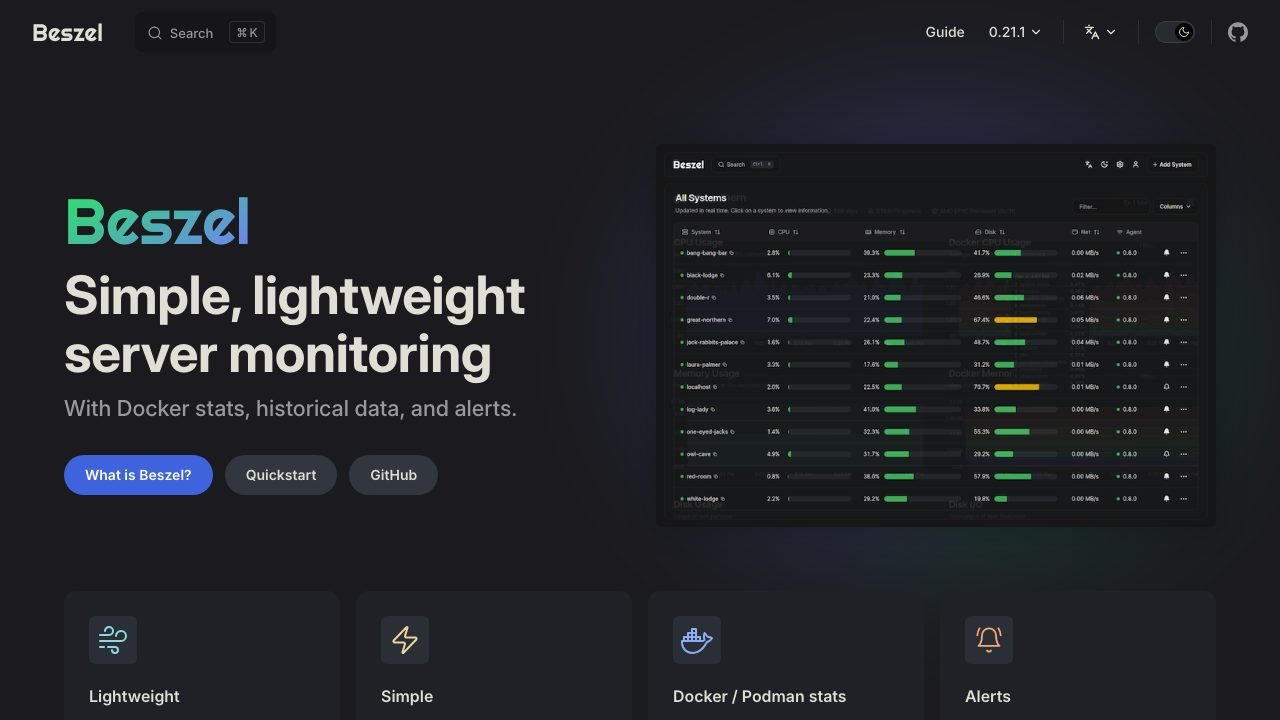
A lightweight self-hosted server monitor with Docker stats, alerts, and historical charts.
 Underrated
Bruno
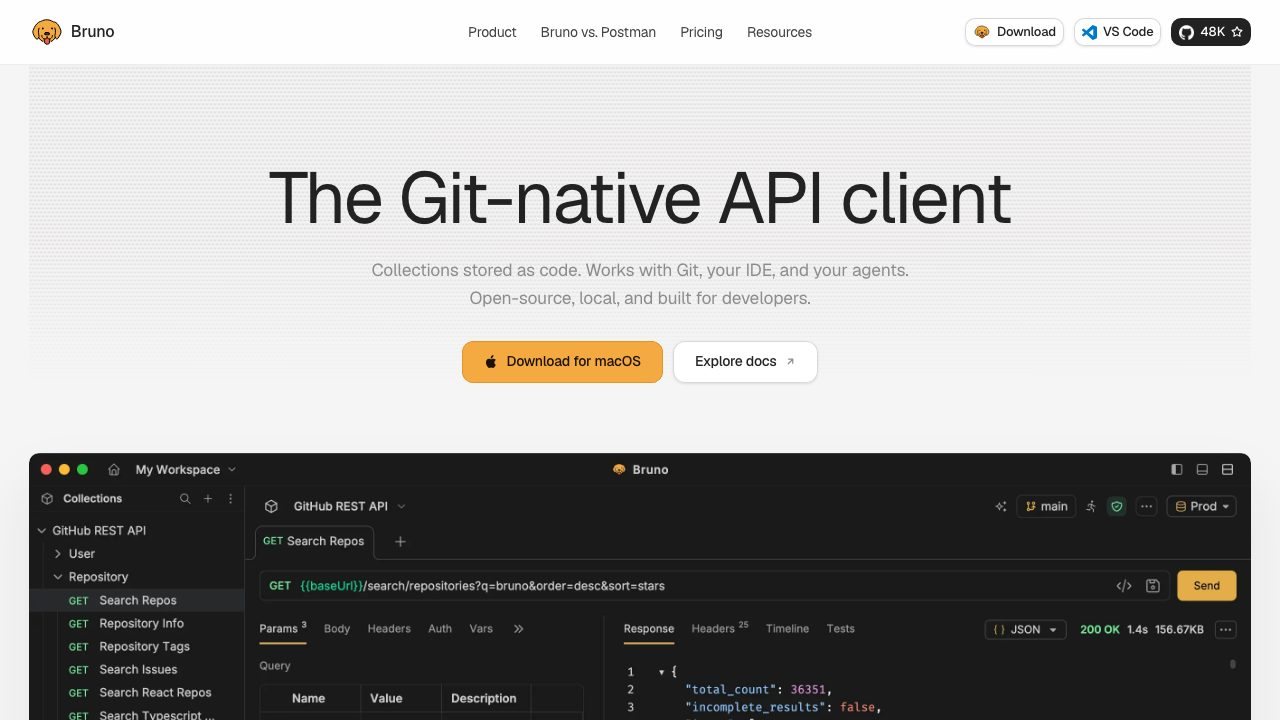
A local-first API client that stores collections as plain files, so changes live in Git.