 SoftBests
btop
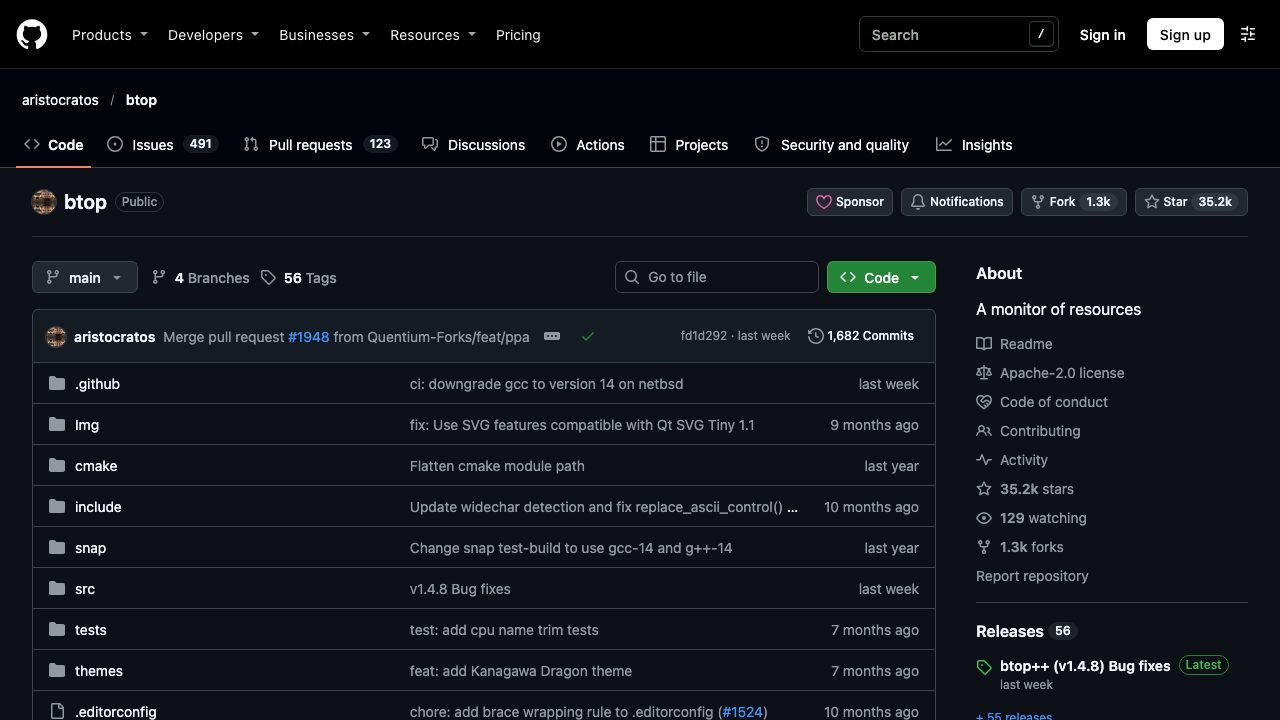
A polished terminal resource monitor for CPU, memory, disks, network, and processes.
Best for
Anyone who wants a readable system dashboard over SSH without installing a GUI monitor.
Why it deserves attention
btop draws live graphs for CPU cores, memory, disks, network, and processes in a single terminal window, with themes, mouse support, and per-process signals. It runs on Linux and macOS, is Apache-2.0 licensed, and is actively maintained with more than 30,000 GitHub stars. It is far more legible than top or htop on a modern terminal. It is still a local monitor: for fleet metrics you need Prometheus, Netdata, or a hosted service.
Ratings & reviews
0 ratings0 people rated this
No ratings yet. Be the first to rate this tool.
Can replace
- top
Related and alternatives
More in Terminal
 Underrated
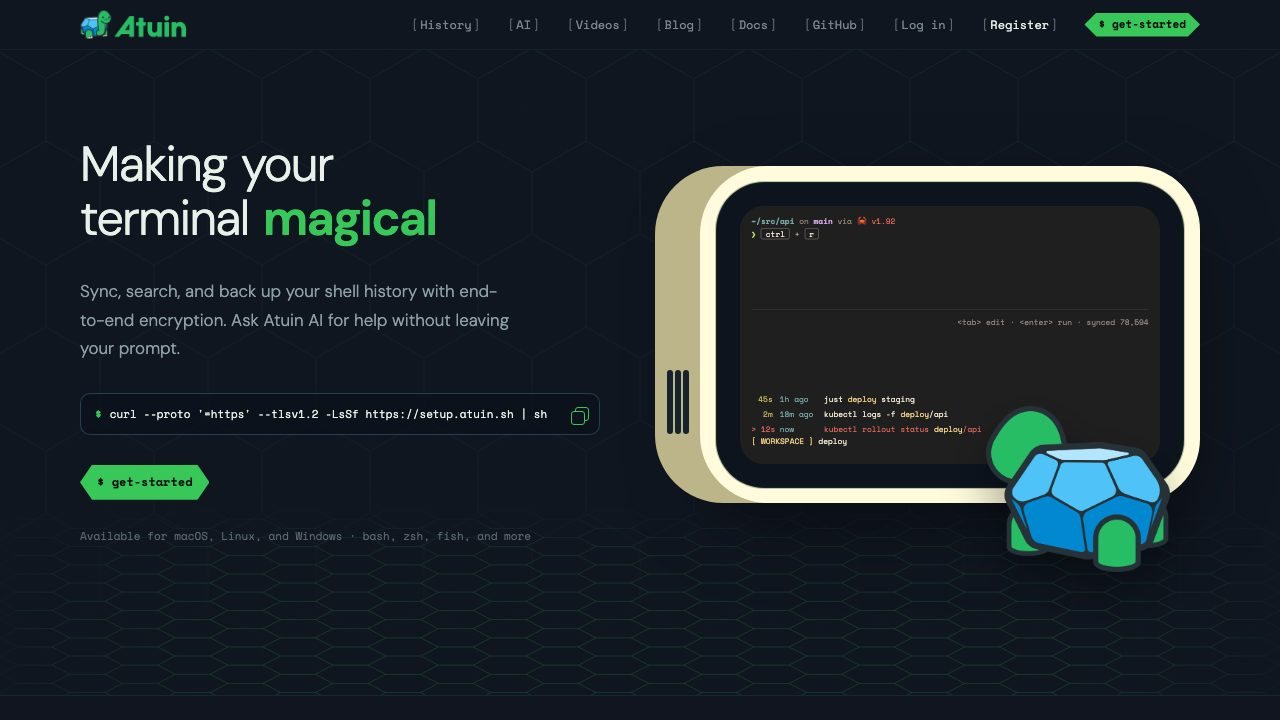
Atuin
Shell history stored in SQLite, with fuzzy search and optional end-to-end encrypted sync.
 Underrated
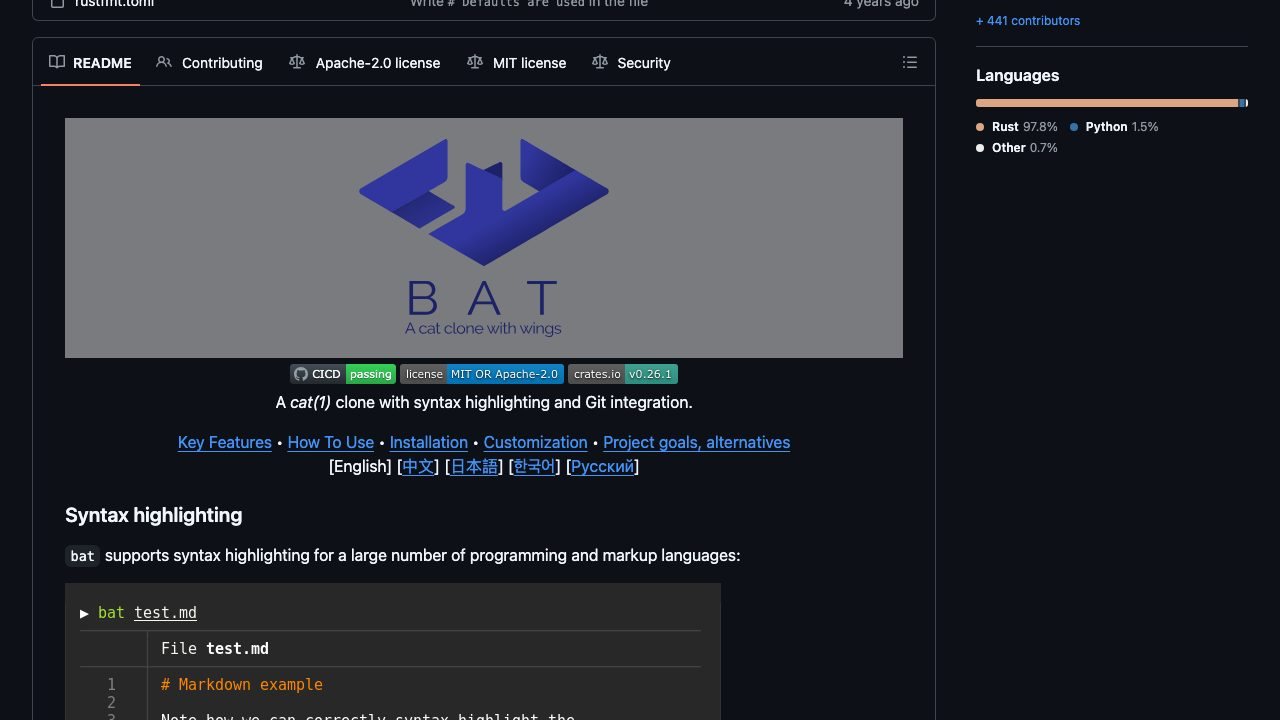
bat
cat with syntax highlighting, line numbers, Git change markers, and automatic paging.
 Underrated
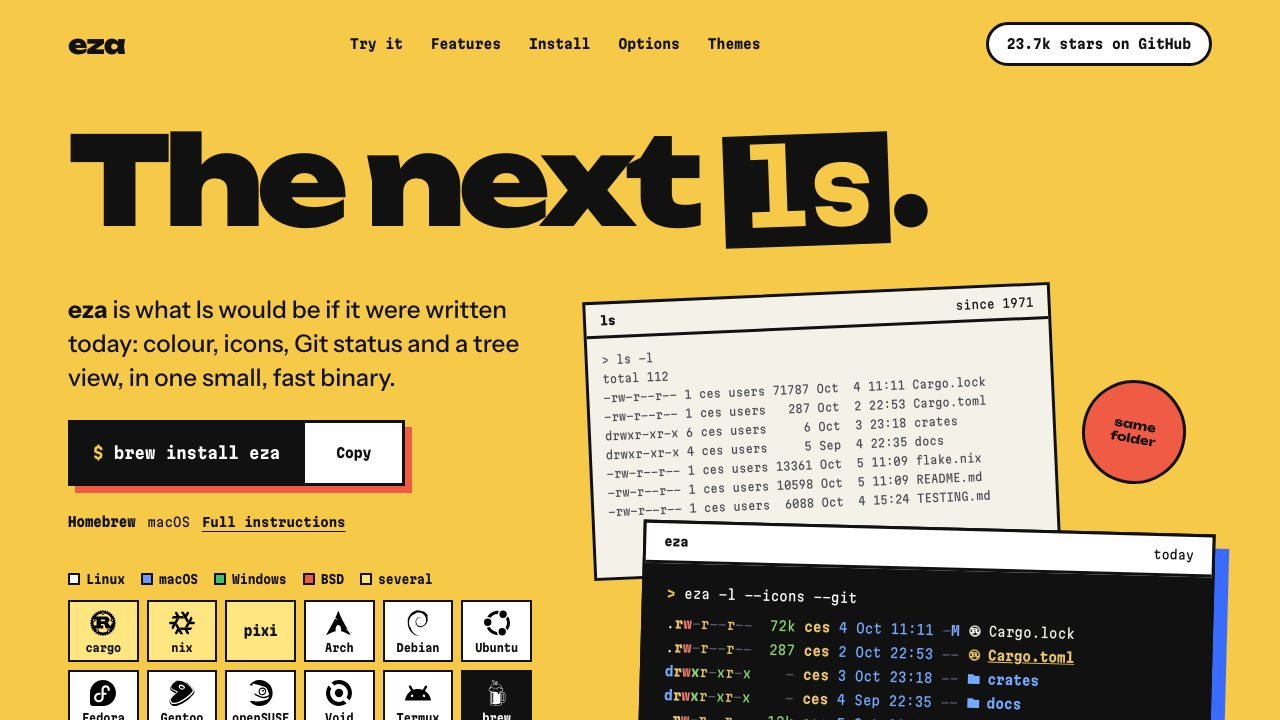
eza
A modern ls with colors, icons, Git status, and a readable tree view.